Note
Click here to download the full example code
Grdclip
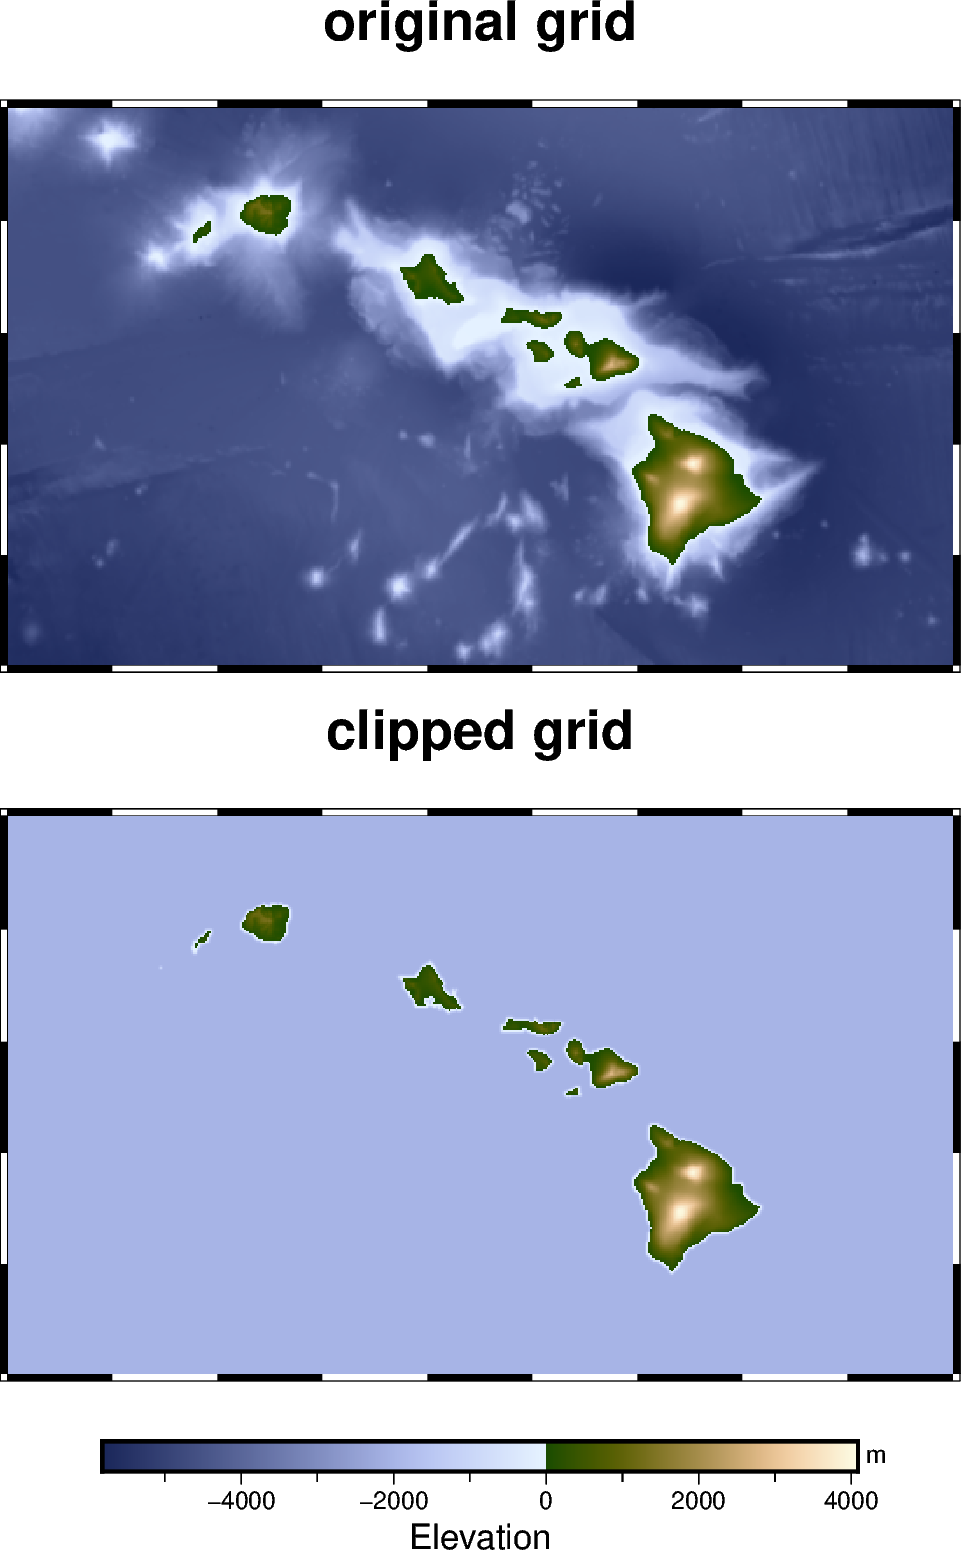
The pygmt.grdclip method allows to clip defined ranges of grid values.

Out:
grdblend [NOTICE]: Remote data courtesy of GMT data server oceania [http://oceania.generic-mapping-tools.org]
grdblend [NOTICE]: Earth Relief at 1x1 arc minutes from Gaussian Cartesian filtering (1.9 km fullwidth) of SRTM15+V2.1 [Tozer et al., 2019].
grdblend [NOTICE]:   -> Download 30x30 degree grid tile (earth_relief_01m_p): N00W180
<IPython.core.display.Image object>
import pygmt

fig = pygmt.Figure()

# Load sample grid and use area around the Hawaiian Islands
grid = pygmt.datasets.load_earth_relief(resolution="01m", region=[-162, -153, 18, 23])

# Plot original grid
fig.basemap(
    region=[-162, -153, 18, 23], projection="M12c", frame=["f", '+t"original grid"']
)
fig.grdimage(grid=grid, cmap="oleron")

fig.shift_origin(yshift="-9c")

# Set all grid points < 0 m to a value of -2000 m.
grid = pygmt.grdclip(grid, below=[0, -2000])

# Plot clipped grid
fig.basemap(
    region=[-162, -153, 18, 23], projection="M12c", frame=["f", '+t"clipped grid"']
)
fig.grdimage(grid=grid)
fig.colorbar(frame=["x+lElevation", "y+lm"])

fig.show()
Total running time of the script: ( 0 minutes 6.405 seconds)